Copperleaf Announces Fourth Quarter and Fiscal Year 2021 Results
- Full year revenue increases 56% YoY to $69.3 million
- Q4 revenue increases 33% YoY to $21.8 million
- Annual Recurring Revenue grows 39% YoY to $36.8 million
VANCOUVER, BC, March 23, 2022 /CNW/ – Copperleaf Technologies Inc. (TSX: CPLF) (“Copperleaf” or the “Company”), a provider of enterprise decision analytics software solutions, today announced financial results for the fourth quarter and fiscal year ended December 31, 2021. All amounts are expressed in Canadian dollars unless otherwise stated.
“Copperleaf demonstrated continued momentum in the fourth quarter, delivering 39% Year over Year (YoY) growth in Annual Recurring Revenue, 47% YoY growth in our Revenue Backlog, and a 116% Net Revenue Retention Rate,” said Judi Hess, CEO of Copperleaf. “The 56% Year over Year revenue growth we achieved in 2021 was driven by our best-in-class enterprise decision analytics software, supported by strong direct sales execution and our expanding alliance partner ecosystem. Today, our solution is being used to manage an estimated $2.6 trillion of infrastructure across multiple industry sectors, including energy, water, transportation, and government, in more than 24 countries. Our results speak to the significant value we provide to our clients as well as the growing need for the solutions Copperleaf provides.”
Fourth Quarter 2021 Financial Highlights
(All Capitalized terms not defined herein, shall have the meaning ascribed to them in the Management’s Discussion and Analysis for the year ended December 31, 2021; Comparison period is the year ended December 31, 2020, unless otherwise stated)
- Record revenue of $21.8 million, an increase of 33% over Q4 2020, driven by the increase in new clients and the expansion of existing clients.
- Subscription revenue of $8.5 million, an increase of 46% over Q4 2020.
- Gross profit of $17.3 million, a 29% increase from $13.4 million in Q4 2020, representing a Gross Margin of 79%.
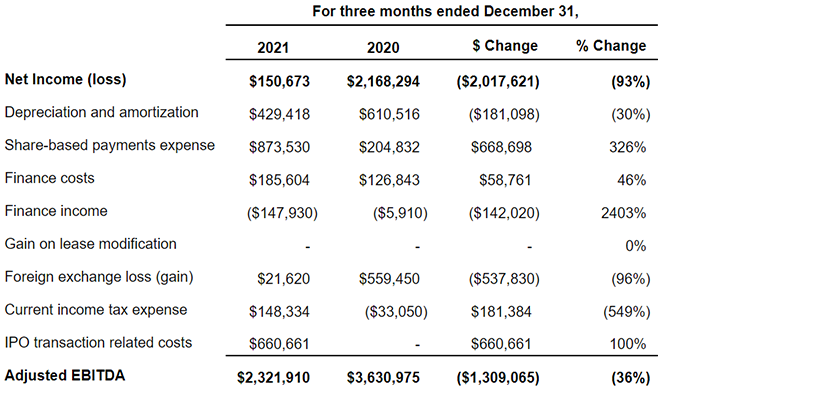
- Adjusted EBITDA1 of $2.3 million, compared to $3.6 million in Q4 2020. Net income of $0.2 million, or $0.00 per diluted share, compared to net income of $2.2 million, or $0.03 per diluted share, in Q4 2020.
- As of December 31, 2021, Copperleaf’s Revenue Backlog1 grew 47% to $101.9 million, compared to $69.2 million as of December 31, 2020.
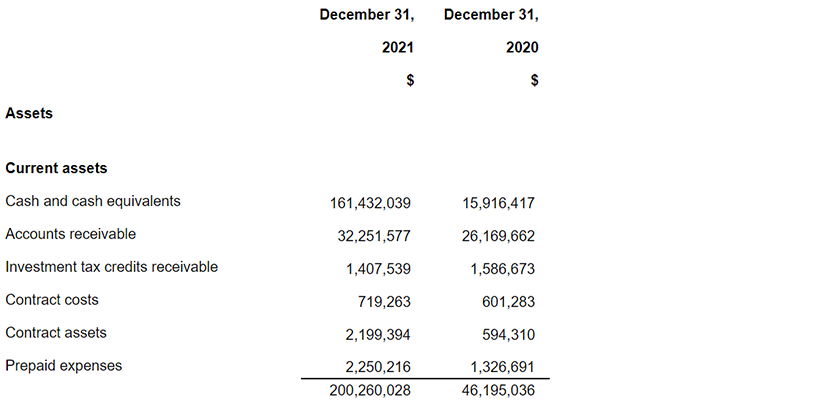
- Strong balance sheet with cash and cash equivalents of $161.4 million as at December 31, 2021, compared to $15.9 million at December 31, 2020.
Fiscal Year 2021 Financial Highlights
(All Capitalized terms not defined herein, shall have the meaning ascribed to them in the Management’s Discussion and Analysis year ended December 31, 2021; Comparison period is the year ended December 31, 2020, unless otherwise stated)
- Record revenue of $69.3 million, an increase of 56% over the prior year, driven by the increase in new clients and the expansion of existing clients.
- Annual Recurring Revenue1 as at December 31, 2021 of $36.8 million, a 39% increase from $26.4 million as at December 31, 2020.
- As of December 31, 2021, the Company’s Net Revenue Retention Rate1 was 116%.
- Subscription revenue of $31.4 million, an increase of 58% over the prior year.
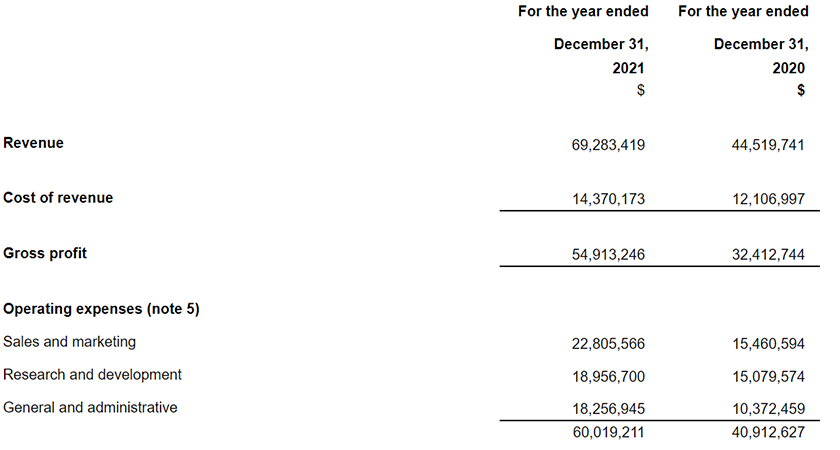
- Gross profit of $54.9 million, a 69% increase from $32.4 million in the prior year, representing a Gross Margin of 79% as compared to a Gross Margin of 73% as at December 31, 2020. The YoY growth reflects an increase in revenue, successful remote delivery resulting in less travel, as well as an improvement in utilization.
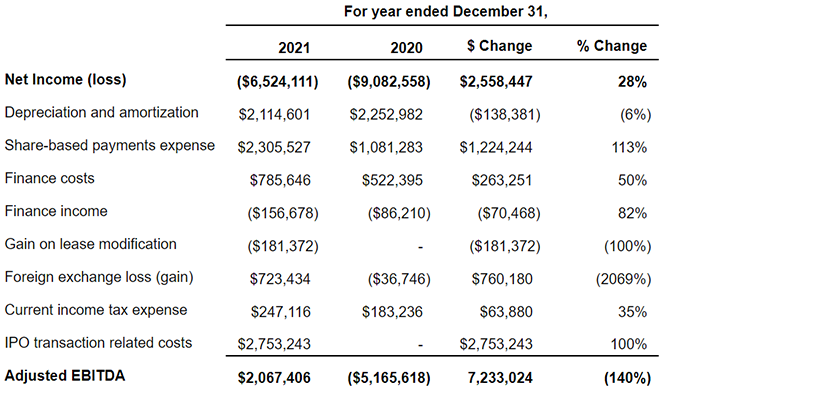
- Adjusted EBITDA1 of $2.1 million, compared to a loss of $5.2 million in the year ended December 31, 2020.
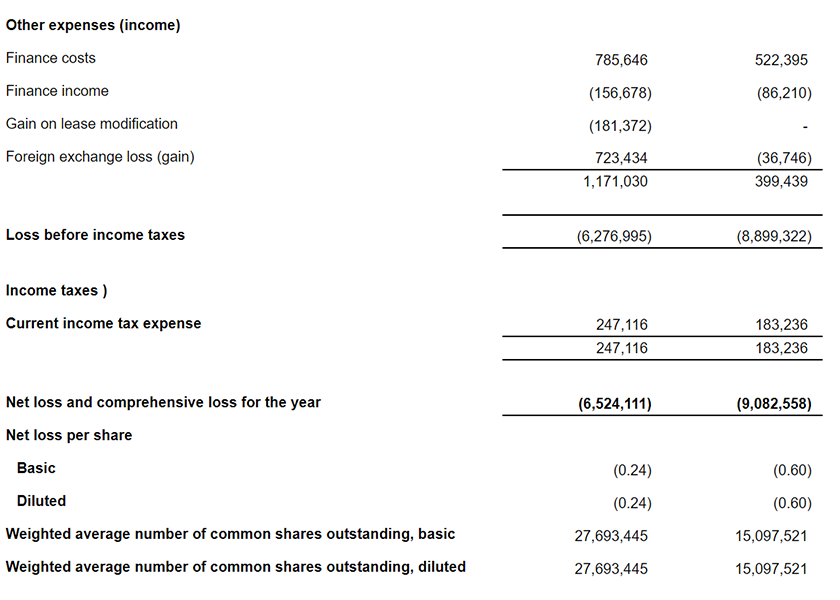
- Net loss of $6.5 million, or a loss of $0.24 per basic and diluted share, compared to net loss of $9.1 million, or a loss of $0.60 per basic and diluted share, in the prior year.
1 Please refer to “Non-IFRS Measures” section of this press release
“Building on a record 2021, our outlook for 2022 is supported by a record backlog, sustained growth tailwinds for decision analytics software, and a broader and deeper pipeline than ever for our business,” continued Ms. Hess. “Copperleaf is leveraging global consulting and service partners who are enhancing our own internal sales efforts to identify new prospects and convert them to clients. The decision analytics market is still in the early stages of a long-term growth cycle, and we are ideally positioned to be leaders in this space.”
Key Developments
In 2021, the Company launched the Copperleaf Product Suite composed of three products: Copperleaf Portfolio, Copperleaf Asset and Copperleaf Value, and the Company’s C55 software solution product name was retired. These solutions provide the Company’s clients with the ability to maximize the value they receive from making investments in their businesses by improving capital allocation and efficiency.
Water and waste-water officially became core sectors at Copperleaf in 2021, alongside energy. Copperleaf also expanded its footprint in the transportation sector, announcing that both the California department of transportation (Caltrans), and National Highways in the UK had selected the Copperleaf Decision Analytics solution. The adoption of the Copperleaf solution by these industry leading organisations in North America and Europe will help accelerate our growth in this new sector.
Throughout 2021, our global Alliance Ecosystem continued to gain traction as partners are building their Copperleaf practice areas. We saw a large increase in active partner pursuits during fiscal year 2021 and formed two new strategic alliances with Guidehouse and Black & Veatch Management Consulting, LLC.
The Copperleaf Community client forum is active and growing, with nearly half of our clients participating in client-led innovation with Copperleaf Labs during 2021. Throughout 2021, the Company delivered over 80 new innovative features to our client base:
- Q1: Copperleaf enhanced its automation and AI capabilities by providing automatic rules-based grouping of projects for assets, based on geospatial and asset information. This is key for our clients in transmission, distribution, and transportation market sectors.
- Q2: Copperleaf created a low-code/no-code formula generation environment for modeling value, to support our goal to make value-based decision making accessible to everyone and it is now delivered to the market in Copperleaf Value.
- Q3: Copperleaf released a new costing option to generate more accurate cost estimates using parameterized models, and better cost estimation results in better decisions.
- Q4: Copperleaf released “Fiscal scenario parameters” – a key innovation which democratizes complex scenario analysis, allowing our clients to advance their maturity with what-if scenarios by easily including new, advanced financial metrics in their analysis, reaching deeper insights and reducing the need for further manual financial analysis.
In 2021, Copperleaf created a new development team focused on data analytics and data strategy, staffed by over 50 years of machine learning and big-data experience. The Company also made great strides in improving its cloud-based software infrastructure, reducing the manual effort of many key deployment and verification steps by over 50%. Copperleaf also successfully renewed its SOC2 Type2 certification in 2021.
On October 14, 2021, Copperleaf closed its initial public offering (the “IPO”) of Common Shares. The IPO was led by BofA Securities, BMO Capital Markets and William Blair, as joint bookrunners, and CIBC Capital Markets, RBC Capital Markets, Canaccord Genuity and Cormark Securities (collectively, the “Underwriters”). Pursuant to the IPO, Copperleaf issued 10,741,000 Common Shares at a price of $15.00 per Common Share for total gross proceeds of $161,115,000, which included the exercise in full by the Underwriters of their over-allotment option to purchase up to 1,401,000 additional Common Shares. The Common Shares are now listed on the Toronto Stock Exchange under the symbol “CPLF”.
Throughout 2021, the increasing focus on ESG initiatives and the energy transition across our target market sectors helped generate increased interest in Copperleaf solutions. As a result, ESG influenced half of our sales in 2021 and has contributed to the expansion our global pipeline. In November 2021, Copperleaf undertook a comprehensive communications campaign in conjunction with the COP26 conference highlighting how we help our clients operationalise their ESG strategies.
Q4 2021 Financial Results Conference Call Details
Judi Hess, Chief Executive Officer and Chris Allen, Chief Financial Officer, will host a conference call followed by a question-and-answer session today, March 23, 2022, at 5:00 PM ET.
Date: March 23, 2022
Time: 5:00pm ET
Dial-In Number: 416-764-8659 or 1-888-664-6392
Webcast: https://bit.ly/3h7KgJk
Replay: 416-764-8677 or 1-888-390-0541 (Available until March 30, 2022)
Replay Entry Code: 404246#
Key Performance Indicators
The Company monitors a number of key performance indicators to evaluate performance. Some of the key performance indicators used by management are recognized under IFRS, whereas others are non-IFRS measures and are not recognized under IFRS. These non-IFRS measures are provided as additional information to complement the IFRS measures by providing further understanding of our results of operations from management’s perspective. We believe that non-IFRS financial measures are useful to investors and others in assessing our performance; however, these measures should not be considered as a substitute for reported IFRS measures nor should they be considered in isolation. As these measures are not recognized measures under IFRS, they do not have a standardized meaning prescribed by IFRS and therefore may not be comparable to similar measures presented by other companies. For a reconciliation of the non-IFRS measures to the most directly comparable measure calculated in accordance with IFRS, see Non-IFRS Measures below.
1 Non-IFRS Measures
Annual Recurring Revenue
We define ARR as the annualized equivalent value of the subscription revenue of all existing contracts as at the date being measured, excluding non-recurring SaaS and hosting fees. Our clients generally enter into three-to-five-year contracts that are non-cancelable or cancelable with penalty. Our calculation of Annual Recurring Revenue assumes that clients will renew the contractual commitments on a periodic basis as those commitments come up for renewal. Subscription agreements are subject to price increases upon renewal reflecting both inflationary increases and the additional value provided by our solutions. In addition to the expected increase in subscription revenue from price increases over time, existing clients may subscribe for additional products or services during the term. We believe that this measure provides a fair real-time measure of performance in a subscription-based environment.
Net Revenue Retention Rate
We believe that our Net Revenue Retention Rate is a key measure to provide insight into the long-term value of our clients and our ability to retain and expand revenue from our client base over time. Our Net Revenue Retention Rate is calculated over a trailing twelve-month period by considering the group of clients on our platform as of the beginning of the period and dividing our Annual Recurring Revenue attributable to this same group of clients at the end of the period by the Annual Recurring Revenue at the beginning of the period. By implication, this ratio excludes any Annual Recurring Revenue from new clients acquired during the period but does include incremental sales added to the cohort base of clients during the period being measured. This measure provides insight into client expansions, downgrades, and churn, and illustrates the growth potential of our client base alone.
Revenue Backlog
Revenue Backlog represents the total revenue expected to be recognized in the future, related to performance obligations that are unsatisfied or partially unsatisfied at period end. The recurring nature of our revenue provides high visibility into future performance, and upfront payments result in cash flow generation in advance of revenue recognition. Subscription contracts require annual upfront payments; however, some clients pay multiple years upfront. Typically, approximately 50% of our expected annual revenue is recognized from client contracts that are in place at the beginning of the year, and this continues to be our target model going forward. However, this also means that agreements with new clients or agreements with existing clients purchasing incremental product and services in a quarter may not contribute significantly to revenue in the current quarter. For example, for SaaS contracts and professional services, a new client who enters into an agreement late in a quarter will typically have limited contribution to the revenue recognized in that quarter. Perpetual licenses, by contrast, are often recognized as revenue upon delivery of the software which typically occurs immediately upon contracting, and thus rarely enters Revenue Backlog.
Adjusted EBITDA
Adjusted EBITDA is used by management as a supplemental measure to review and assess operating performance and to provide a more complete understanding of factors and trends affecting our business.
Management believes that Adjusted EBITDA is a useful measure of operating performance and our ability to generate cash-based earnings, as it provides a more relevant picture of operating results by excluding the effects of financing and investing activities, including removing the effects of interest and other expenses such as non-cash items and non-recurring expenses that are not reflective of our underlying business. In addition to interest, the other non-cash or non-recurring items adjusted for include depreciation and amortization, share-based payments expense, gain on lease modification, foreign exchange loss (gain), current income tax expense, and IPO transaction related costs. Our management also uses Adjusted EBITDA in order to facilitate operating performance comparisons and decision making from period to period and to prepare annual operating budgets and forecasts. In addition, it is used to provide securities analysts, investors, and other interested parties with supplemental measures of our operating performance and thus highlight trends in our business that may not otherwise be apparent when relying solely on IFRS measures. The following tables reconcile Adjusted EBITDA to net loss for the periods indicated:
Selected Financial Information
Consolidated Statements of Loss and Comprehensive Loss
(expressed in Canadian dollars)
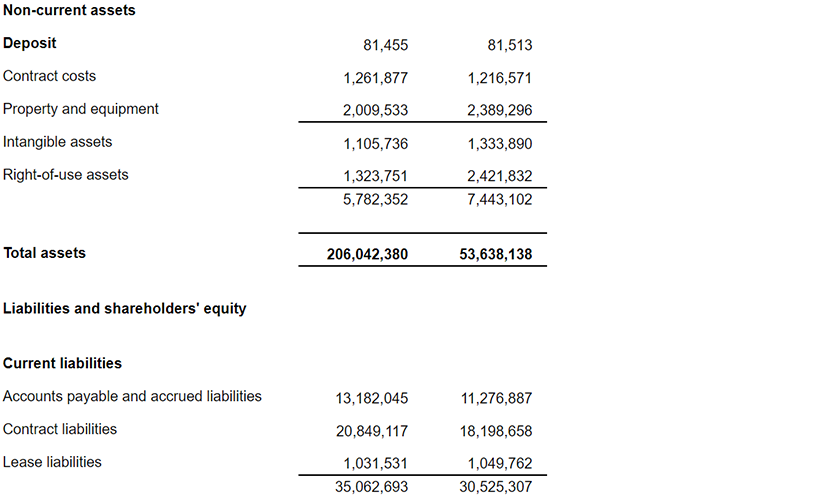
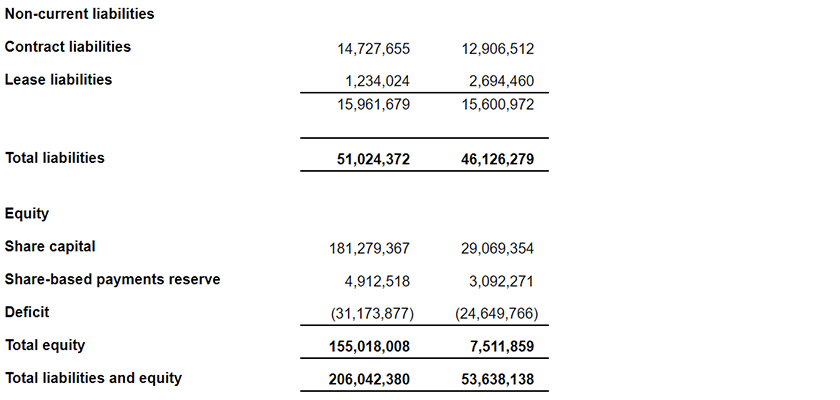
Consolidated Statements of Financial Position
(expressed in Canadian Dollars)
Disaggregation of revenue

Cautionary Note Regarding Forward-Looking Information
Except for statements of historical fact, this press release contains certain forward-looking statements and forward-looking information within the meaning of applicable securities law. Such forward-looking statements and information include, but are not limited to, statements or information with respect to: the Company’s future business and strategies; industry demand; ability to obtain employees, consultants or advisors with specialized skills and knowledge; anticipated joint development programs; incurrence of costs; competitive conditions; general economic conditions; and scalability of developed technology.
Forward-looking information is frequently characterized by words such as “plan”, “project”, “intend”, “believe”, “anticipate”, “estimate” and other similar words, or statements that certain events or conditions “may” or “will” occur. Although the Company’s management believes that the assumptions made and the expectations represented by such statement or information are reasonable, there can be no assurance that a forward-looking statement or information referenced herein will prove to be accurate. Forward-looking statements are based on the opinions and estimates of management at the date the statements are made and are subject to a variety of risks and uncertainties and other factors that could cause actual events or results to differ materially from those anticipated in the forward-looking statements. Factors that could cause actual results to differ materially from those in forward-looking statements include, but are not limited to, the following: (i) our limited operating history and history of incurring operating losses; (ii) the substantial portion of our revenue being accounted for by a limited number of clients; (iii) intense competition having a potential adverse effect on our business, financial condition and results of operations; (iv) our sales cycles, particularly with respect to large contracts, being long and unpredictable at times; (v) certain revenue metrics not being accurate indicators of our future financial results; (vi) our dependence on key personnel to grow our business and our ability to attract and retain specialized technical, management or sale and marketing talent and maintain our corporate culture; (vii) changes to our pricing models having potential adverse effects on operating results; (viii) our dependence on strategic relationships with third parties for revenue growth and our ability to establish and maintain successful relationships with them; (ix) certain contracts potentially exposing us to high liabilities; * our client base being impacted by our ability to develop and expand marketing and sales capabilities; (xi) our ability to successfully manage growth and plan for future growth; (xii) the ongoing Covid-19 pandemic could adversely impact our business and operations and the impact on remote work could disrupt our local compensation markets; (xiii) our business performance not being fully reflected by our quarterly results and key metrics due to significant fluctuations; (xiv) our dependence on our ability to offer high-quality maintenance and support services in order to maintain client relationships; (xv) the use and adoption of our platform could be limited and our business could be adversely affected by cyber security, privacy, data protection, and information security concerns; data collection and transfer restrictions and related domestic or foreign regulations; (xvi) our exposure to foreign currency exchange rate fluctuations; (xvii) sales to government entities and highly regulated organizations being subject to certain challenges and risks; (xviii) our ability to achieve and sustain a level of liquidity sufficient to support our operations and fulfill our obligations; (xix) conflicts of interest arising due to our business and client relationships with certain entities who are shareholders or who are affiliated with our directors; (xx) regulatory requirements placed on our software and services could impose increased costs on us, delay or prevent the introduction of new products and services, and impair the function or value of existing products and services; (xxi) our management team being exposed to new challenges and requirements as a result of its limited experience managing a public company; (xxii) our business being subject to the risk of natural catastrophic events and to interruption by man-made problems; (xxiii) exposure to increased business and economic risks as a result of continued expansion of our operations outside Canada; (xxiv) international operations subjecting us to potentially adverse tax consequences; (xxv) our potential profitability could be adversely affected if we are unable to utilize a significant portion of our net operating loss; (xxvi) indemnity provisions in various agreements could potentially expose us to substantial liability for Intellectual Property infringement and other losses; (xxvii) our use of open source software in our products could expose us to additional risks and harm our Intellectual Property; (xxviii) issues in the use of artificial intelligence in our platform could result in reputational harm or liability; (xxix) the potential volatility of the market price for our Common Shares; (xxx) our share price may decline due to the fact that there has been no prior public market for the Company’s securities and other factors; (xxxi) the price of our Common Shares being impacted by securities analysts’ research or reports and future sales of the Common Shares by pre-IPO shareholders; (xxxii) maintaining broad discretion over the use of proceeds received from the IPO; (xxxiii) future sales or issuances of securities by us could decrease the value of our Common Shares, dilute the voting power of holders of Common Shares and reduce our earnings per Common Share; (xxxiv) the Russia-Ukraine conflict and resulting sanctions against Russia could detrimentally impact our business; and (xxxv) the accuracy of the forward-looking statements.
The Company undertakes no obligation to update forward-looking statements and information if circumstances or management’s estimates should change except as required by law. The reader is cautioned not to place undue reliance on forward-looking statements and information. More detailed information about potential factors that could affect results is included in the documents that may be filed from time to time with the Canadian securities regulatory authorities by the Company.
For a more detailed discussion of certain of these risk factors, see the “Risk Factors” section of our 2021 Annual Information Form “AIF”. The list of “Risk Factors” set out in the AIF is not exhaustive of the factors that may affect any of our forward-looking information.
About Copperleaf:
Copperleaf (TSX: CPLF) provides AI-powered enterprise decision analytics software solutions to companies managing critical infrastructure, including physical and digital assets. We leverage operational and financial data to empower our clients to make investment decisions that deliver the highest business value. What sets us apart is our commitment to providing extraordinary experiences, shaped by people who care deeply, products that deliver exceptional value, and partnerships that stand the test of time. Copperleaf is a patron of The Institute of Asset Management and actively participates in shaping the future of asset management standards, including ISO 55000. Headquartered in Vancouver, Canada, our solutions are distributed and supported by regional staff and partners worldwide. Together, we are transforming how the world sees value.

